
Overview
This definition provides the following information to the report user:
-
What templates are provided by default that use this dataset
-
What fields are included in the dataset and how the field value is calculated, where applicable.
Where to find this feature
-
Open the Workspace.
-
Select the Live Reports tab.
-
Hover over Administration.
-
Select Reports.
-
Select the Create tab.
-
Open the Data Set drop-down selection list.
The report templates that are based on this dataset include:
|
Report Name |
Report Description |
|---|---|
|
Agent Performance Wallboard |
This report provides live details of the statuses of one or more agents as well as the duration since the last change |
|
Campaign Dialler Performance Wallboard (see further detail below) |
This is a proprietary report that presents a visual representation of the current or final status of the most recent 100 dial attempts made. |
|
Dialler Progress Wallboard |
This report provides live feedback on the adaptive predictive dialler’s performance using graphs and statistics |
Campaign Dialler Performance Wallboard:
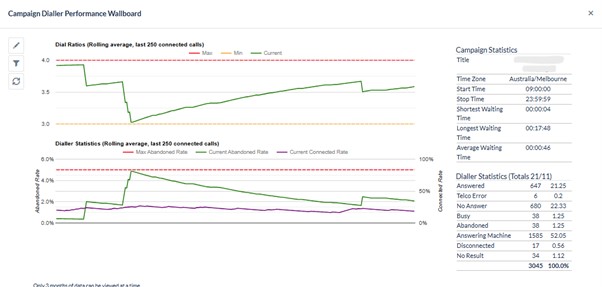
Dial Ratios
Max – The Red line shows the Maximum calls (Max Call Ratio set in the Campaign Dialler settings) the Dialler will make per agent available when your current abandonment rate is under your maximum abandonment rate set in Organisation Settings)
Min – The Yellow line Shows the Maximum calls (Minimum Call Ratio set in the Campaign Dialler settings) the dialer will make per agent available when your current abandonment rate is Over your maximum abandonment rate (set in Organisation Settings )
Current – The Green line shows the Current Ratio being used by the dialler. It will increase as your current abandonment rate decreases and vice versa.
Dialer Statistics
Max Abandonment Rate – The Red line shows the Maximum abandonment rate you have set in the Organisation Settings.
Current Abandonment Rate – The Green Line shows the current abandonment rate the Dialler is managing.
Current Connected Rate – The Purple line shows your current connection rate to your leads (Answered vs. Not Answered).
Campaign Statistics
Title – Name of the campaign you are monitoring.
Time zone – The time-zone of the campaign you are monitoring,
Start Time – The time the dialler is set to start dialling (Note the campaign will only start dialling when assigned agents login and become available).
Stop Time – The time the dialer is set to stop dialling.
Shortest Wait Time – The shortest wait time agents wait between calls being allocated.
Longest Wait Time – The Longest Wait time agents wait between calls being allocated.
Average Wait Time – The average wait time agents wait between calls being allocated.
Dialler Statistics
Default dialler outcomes appear here to show the percentage of calls that have been called and the outcomes the dialler has applied to them. These Outcomes can be seen in the “Wrap Codes” module of your campaign or the “Dialer Strategy” module.