
Overview
This report provides live feedback on the adaptive predictive dialler’s performance by:
-
Graphing, for the selected campaign:
-
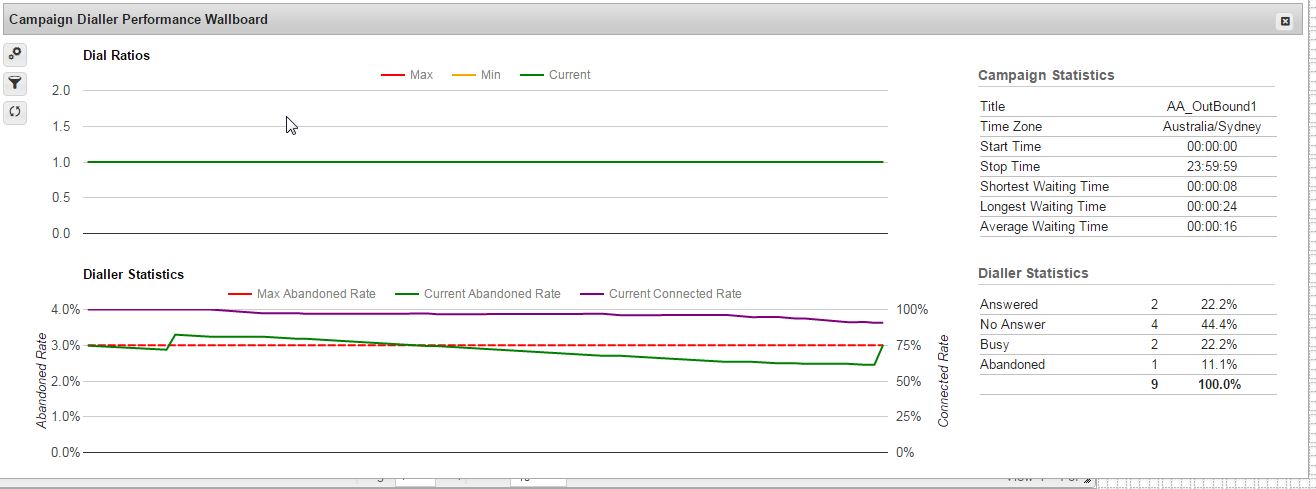
minimum, maximum and actual dial ratios
-
current and maximum allowed abandon rates and current connected rate
-
when the mouse pointer is hovered over a plot, data is presented for the dial instance it is graphing.
-
-
Listing, for the selected campaign:
-
values and % for all dialler statuses
-
dialler window values: time zone, start time, end time
-
shortest, longest, and average waiting time
-
dialler statistics for all applicable call outcomes
-
Where to find this template
See Add a Report to your report page for instructions on accessing this report.
About a report based on this template
This report can be used by Dialler Managers and Supervisors to monitor the performance of the predictive dialler. It can display a single campaign (and therefore, a single dialler) per template.
Interpreting the Dialler Performance Report
The statistics presented in the Campaign Dialler Performance template are functional - not historical. The report provides a view of the statistics that are used by the predictive dialler in order to throttle up and down, attempting to reach maximum efficiency within the set configuration. It does not represent absolute performance for a specific time period - instead providing tactical feedback on the effectiveness of the configuration in real-time.
A trailing view of the last 250 dials is used to present the actual statistics used by the dialler to throttle up and down. Smoothed Moving Averages (SMMA) are used for numbers that must trend towards a set target over time.
Please refer to historical reports on Dialler outcomes for actual Abandon % and Connect Rate % achieved over specific past time periods.
-
Dial Ratios chart - for the last 250 calls:
-
The configured minimum and maximum dial ratios for the campaign
-
The actual dial ratio over time
-
-
Dialler Statistics chart - for the last 250 calls:
-
Graphing of metrics used by the predictive dialler to manage the dialler speed, for the last 250 calls, including:
-
The maximum allowed abandon rate configured in your environment
-
The Smoothed Moving Average (SMMA) of the dialler connected rate
-
The Smoothed Moving Average (SMMA) of the dialler abandon rate
-
-
-
Campaign Statistics table
-
Campaign name, timezone, and start and stop times
-
Wait time metrics (min, max, and average) for the last 24 hours
-
-
Dialler Statistics
-
Dialler outcome counts and % for all dialler statuses for the last 24 hours
-
Relevant Configuration
Some configuration options have a significant impact on the Predictive Dialler's behaviour and as a result, this report. These options are all set in Campaign Configuration, except for the global setting Maximum Abandonment Rate which is set in the top-level Organisation Settings.
-
Dialler Answer Rate Calculation - if this is set to "Direct" mode, the Abandonment rate is ignored by the dialler, instead using the Dial Ratio Scale Factor to moderate the dial ratio. In Feedback mode your global Maximum Abandonment Rate is used to moderate the dial ratio instead of an arbitrary scale factor. Therefore if you need to target a specific Abandon rate threshold, it is strongly recommended to use Feedback mode.
-
Answering Machine False Positive Rate - If this is set to a non-zero value, then Answering Machine dialler outcomes will be weighted as Abandons, increasing the moving Abandon Rate in the chart. eg: If set to 10%, each Answering Machine detected by the dialler will count as 0.1 Abandons.