Web Connect
Overview
IPscape offers numerous options for connectivity to establish a voice path for an agent.
Modernise your contact centre with IPscape’s Web Connect which facilitates calls directly through the web browser without the need for a soft-phone, desk phone, or plug-ins.
Web Connect can be used to login for all instances of IPscape through the Agent toolbar or through your CRM using the CTI adaptor.
1. Requirements
Mozilla Firefox, Google Chrome, and Microsoft Edge Browsers (latest 3 versions)
100kbps bandwidth per connected workstation. To check your network, click here to run a speed test for your current device or workstation.
2. Receiving Inbound Calls on a Non-Persistent Connection
A call will be heard through your computer (please check your volume settings) and you will receive an Inbound Call notification as a pop-up in your browser.
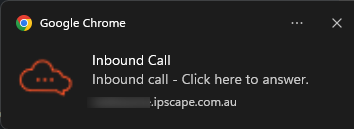
Click once on the notification to Answer
The call will be connected & the icon will change on the Web Connect browser tab

3. Using the Number Pad to send DTMF tones
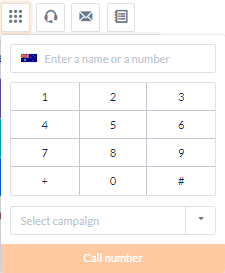
Select the number pad icon on the right of the Enter phone number input, enter the number, select a campaign (if applicable), and click Call number
Web Connect Troubleshooting
If you close the Web Connect tab you may see the following warning message. If you select Leave, your voice path will be dropped

If the voice path has been lost a Voice Disconnected alert will display briefly at the top of the toolbar and Connect Voice will appear in orange next to the voice queue.

To re-establish the voice path, click Connect Voice and connect by your preferred connection mode
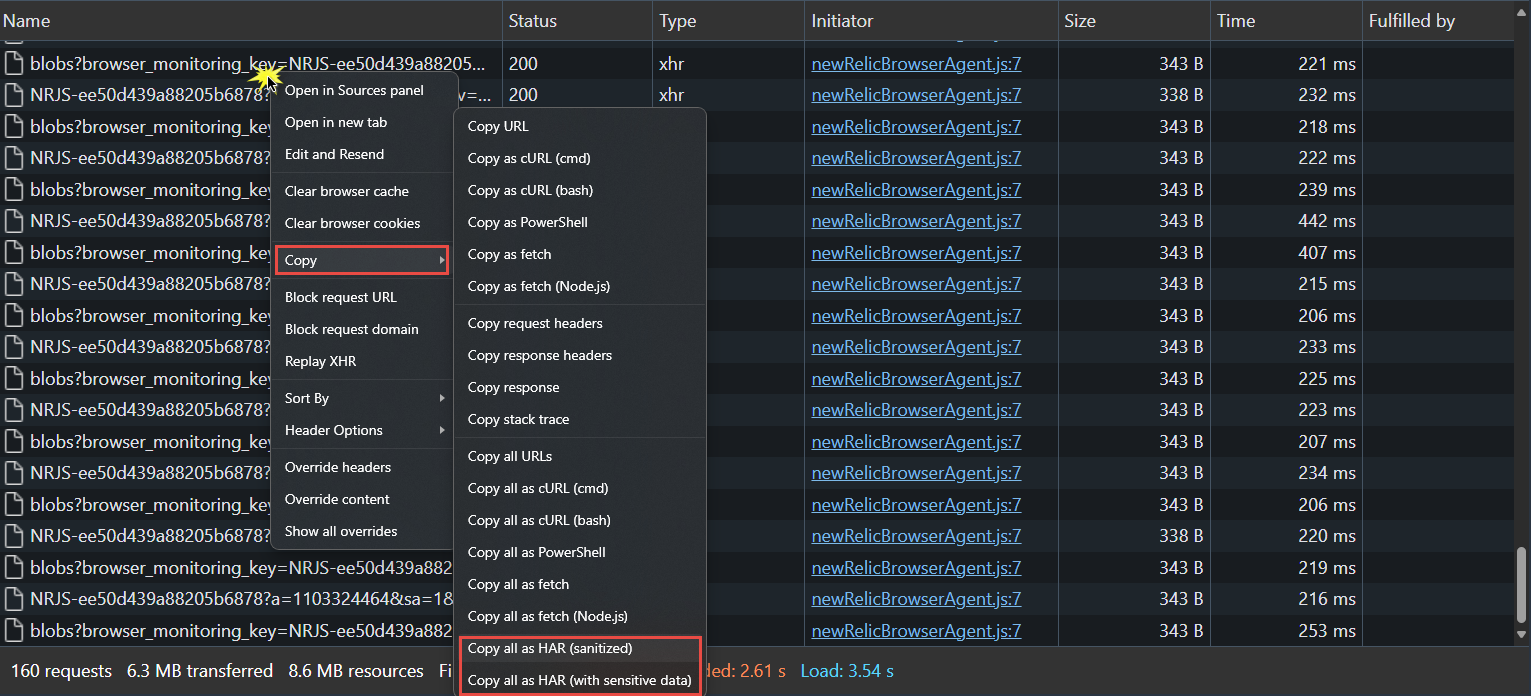
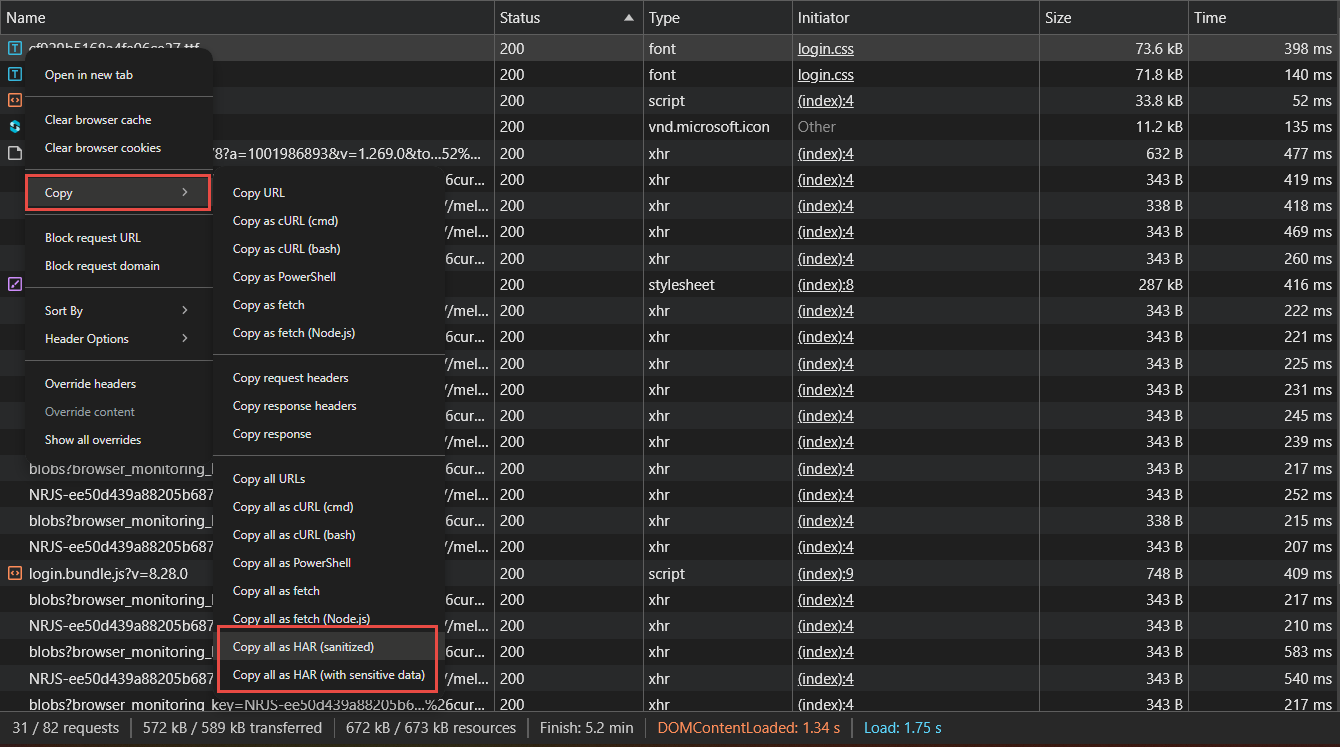
Capture browser network logs
Generating a HAR (HTTP Archive) file can help analyze and troubleshoot web performance issues.
HAR (HTTP Archive) files are a JSON formatted archive file of a web browser’s interaction with a web application. HAR files provide a detailed snapshot of every request, including headers, cookies, and other types of data sent to a web server by the browser. This makes them an invaluable resource to troubleshoot web application issues especially for complex, layered web applications.
HAR files contain:
Complete Request and Response Headers: Every piece of data sent and received, including method types (GET, POST, etc.), status codes, URLs, cookies, and more.
Payload Content: Details of what was exchanged between the client (User) and server, which can be essential for diagnosing issues related to data submission or retrieval.
Timing Information: Precise timing breakdowns of each phase – from DNS lookup, connection time, SSL handshake, to content download – giving insight into performance bottlenecks.
